How can I view my smart usage online?
If you're on a smart plan, you can see your consumption data on your online account.
If you're on a half-hourly smart plans, you'll be able to see your half-hourly consumption data on your online account. You can also download your half-hourly usage data for up to two years. See Can I download my usage data?
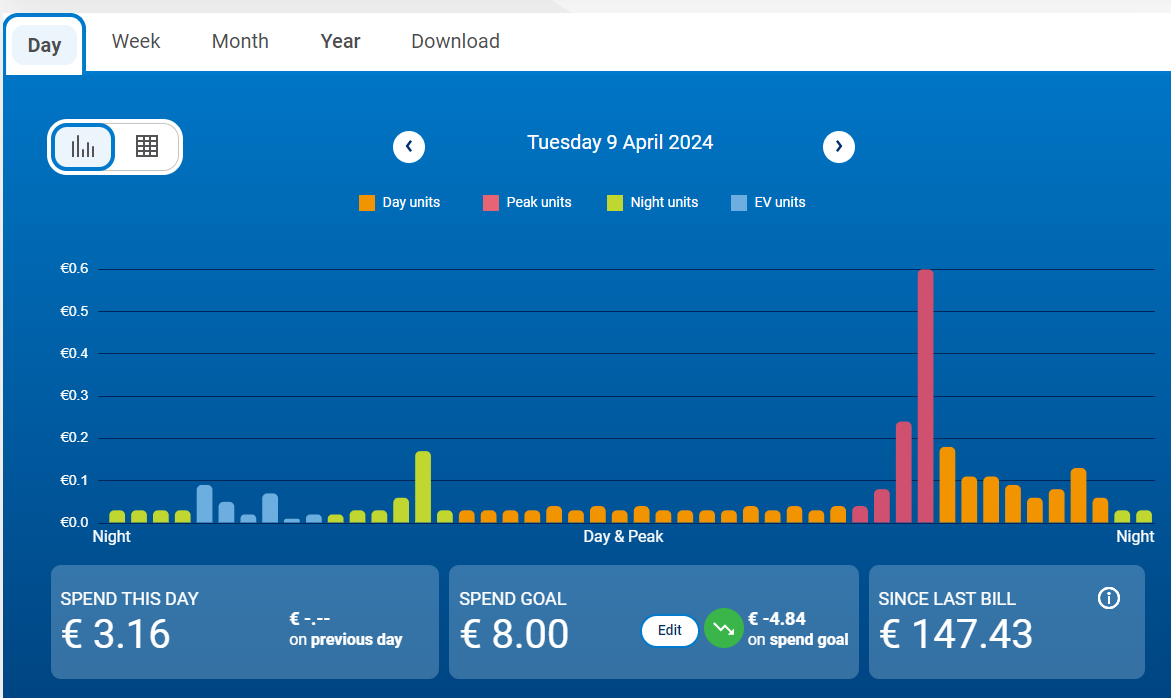
The smart usage graphs display your consumption, so you can analyse and understand your daily energy usage and costs over time. You can view your usage data by day, week, month or year. You can also view your usage in a grid view.
After you switch to a half-hourly smart plan, it can take up to 10 days for your smart usage data to display on your online account.
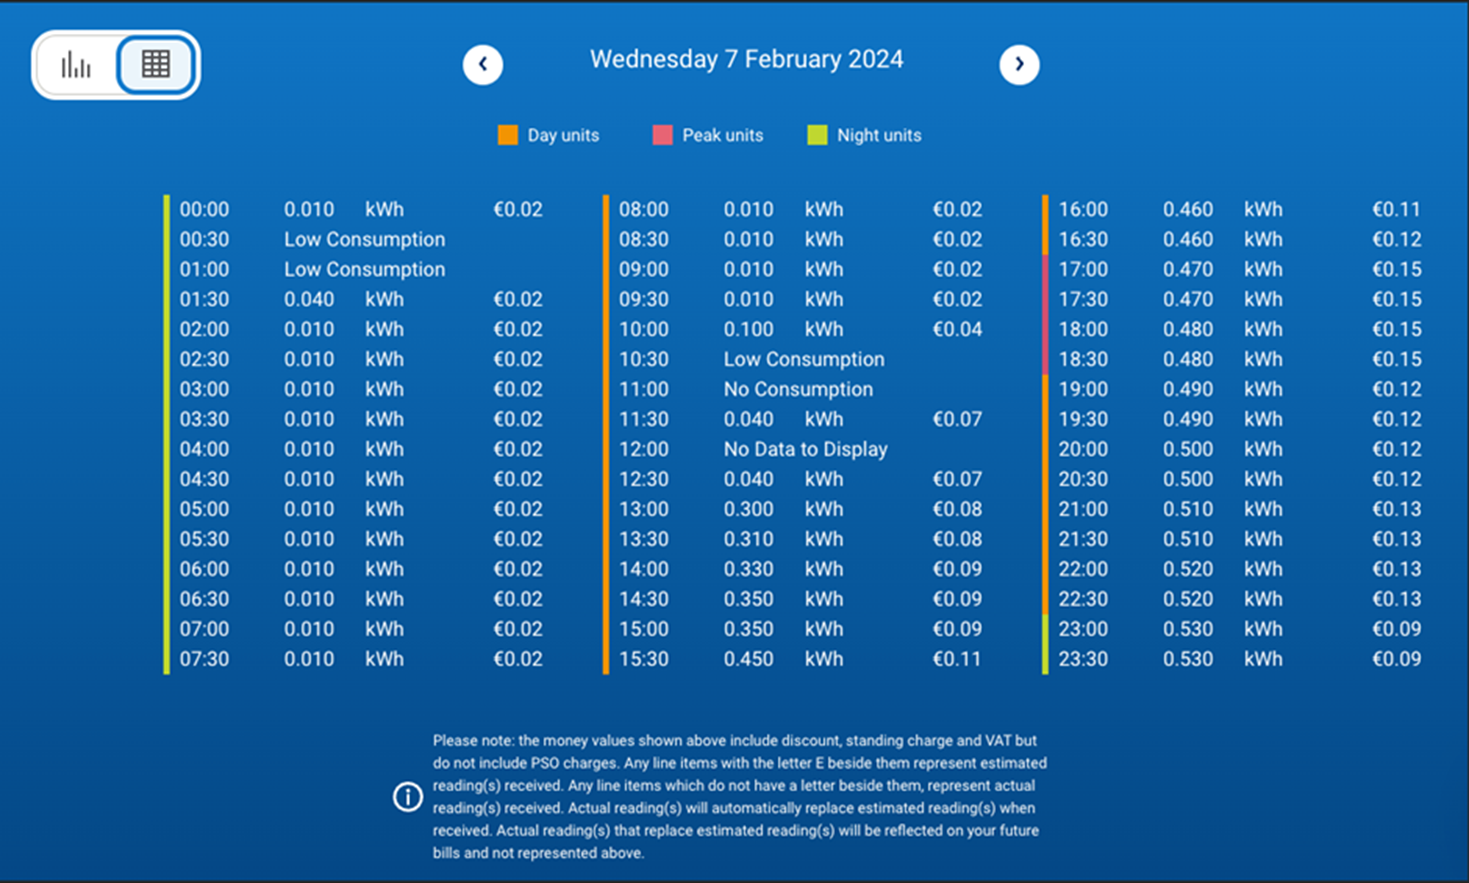
'Low Consumption', 'No Consumption', and 'No Data to Display' labels
If you view your usage using the grid view, you may see the terms 'Low Consumption' or 'No Consumption'.
- If your usage for a half hour is less than 3 decimal places (i.e. less than 0.000, for example 0.0004 kWh) the label 'Low Consumption' will display.
- If there is zero consumption for a half hour, the label 'No Consumption' will display.
- If there is no data available, the label 'No Data to Display' will appear.
Additional information
- Your online usage graphs are not intended to replace your bill.
- Your usage data will only be available for the previous day and further back, not the current day.
- Consumption shown in the graphs relates to usage since your last bill, including discounts and standing charges, plus VAT, but excludes the PSO levy.
- Free-time plans have an annual fair usage cap of 1,200 kWh per year, which is pro-rated per day on your bill. Usage exceeding the cap between 9am-5pm on your free day will be charged at the day unit rate on your bill, but will not appear on the graph.